Store Overview Report
Prerequisites
- You must have
READpermission on at least one store
Explore Your First Report
-
Click on a “Stores” icon on the Menu bar on the left to access Store Overview. Your report should look similar to the below image

-
In the chart you can see all important metrics at first glance compared to the previous period.
-
Please click on Conversion Rate metrics to see its detail grouped by days.
-
You can view data grouped by hour/week/month, by your store hierarchy/ store attribute by clicking on Group by button at the bottom right of the chart.
-
You can switch the view between line chart and bar chart by clicking on the symbol at the bottom right of the chart.

-
Voila, above is the data grouped by hour, visualized in the bar chart. You have made your first exploration using the Palexy data platform. This is just a very brief introduction about our powerful report interface, please read on for more detail.
- Scroll down to the table in the bottom of the page, you can see data grouped by stores and compared with previous periods also. Click on each store on the first column to go to the Store Detail Report for that store. Read this this article to know more on how to use Store Detail Report.

- If there is any store under your management that does not show on the list, please contact your administrator for granting store permissions.
Select Date Range
On the top of the Store Overview page, choose Date filter as below:
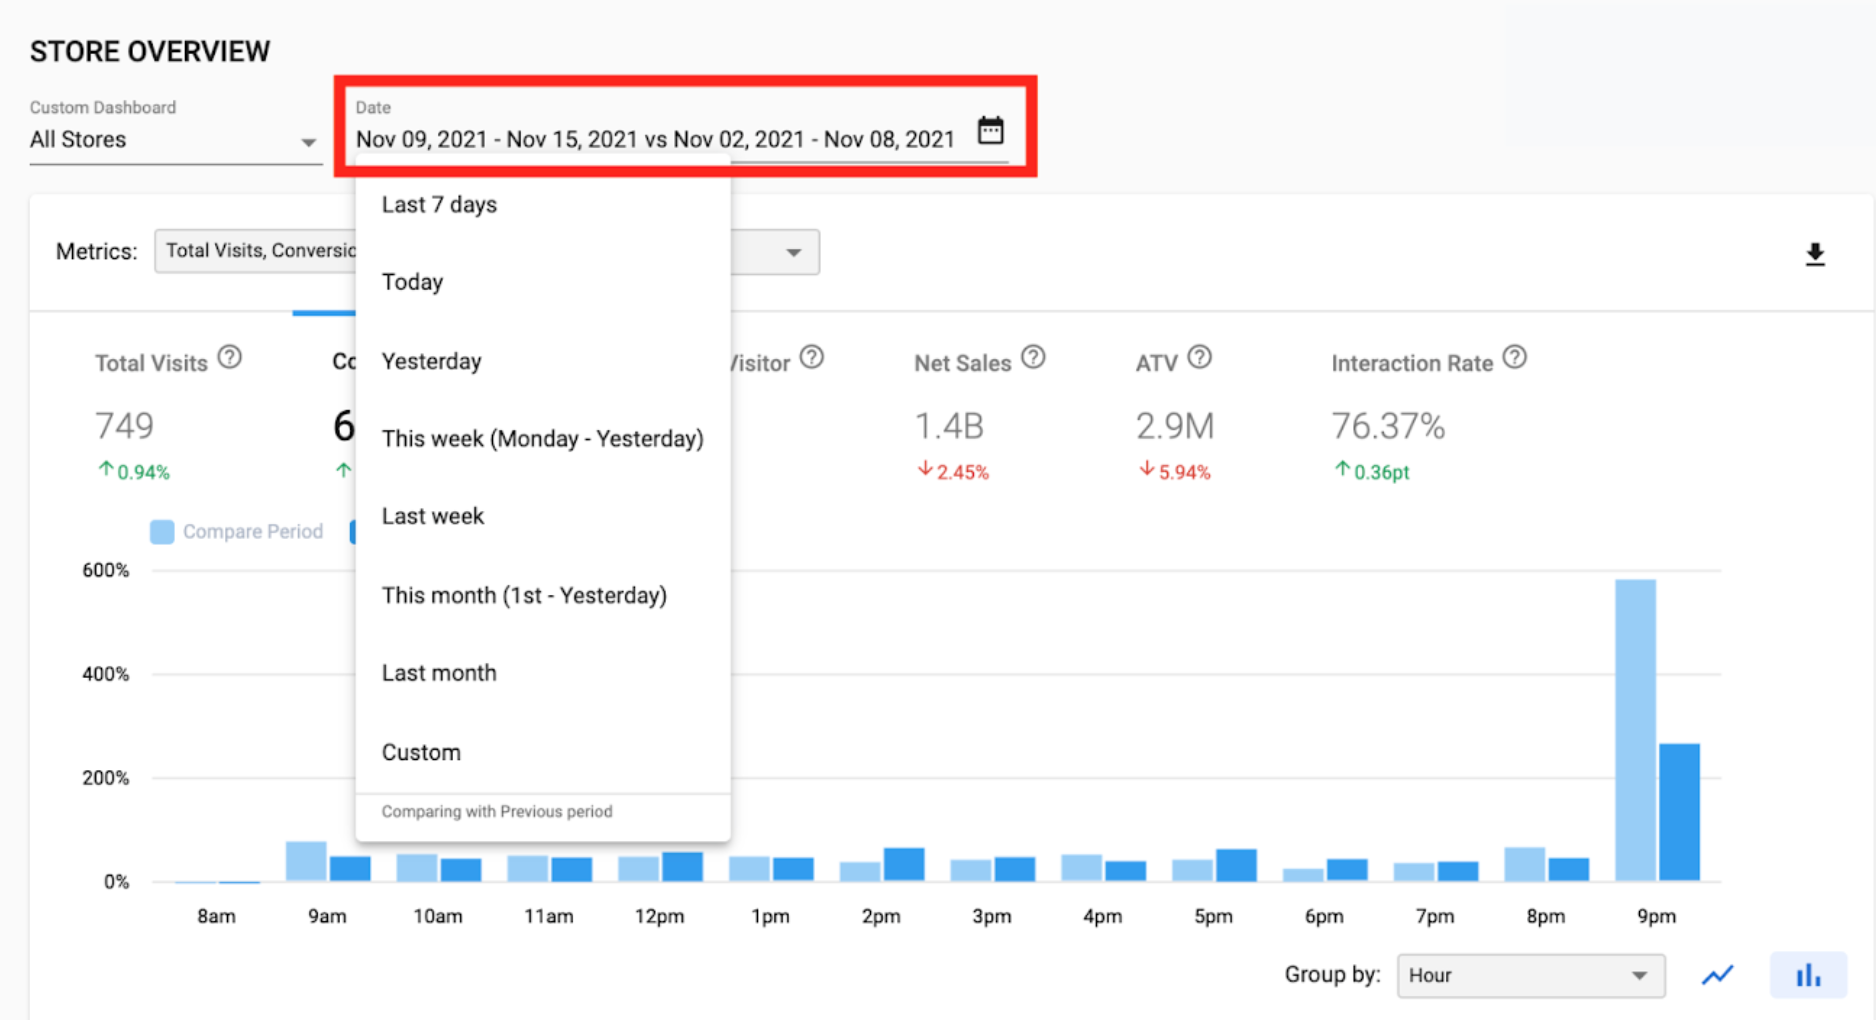
On the drop down, Palexy displays some quick options to choose from, including:
- Last 7 days (not including Today)
- Today
- Yesterday
- This week (from Monday to Yesterday)
- Last week
- This month (from 1st day of this month to Yesterday)
- Last month
- Custom
Alternatively, you can choose to go to Custom view as below in which you can choose arbitrary date range and compare date range periods.
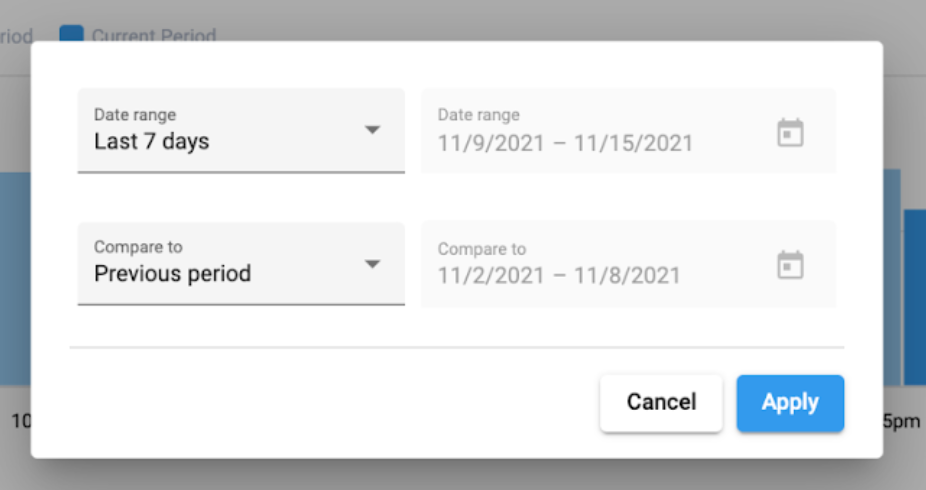
Note that Previous period is the consecutive period in the past with the same length of time with the current period. For example, you view the report from 9th Nov to 15rd Nov, the comparison period is from 2nd Nov to 8th Nov.
Select Stores
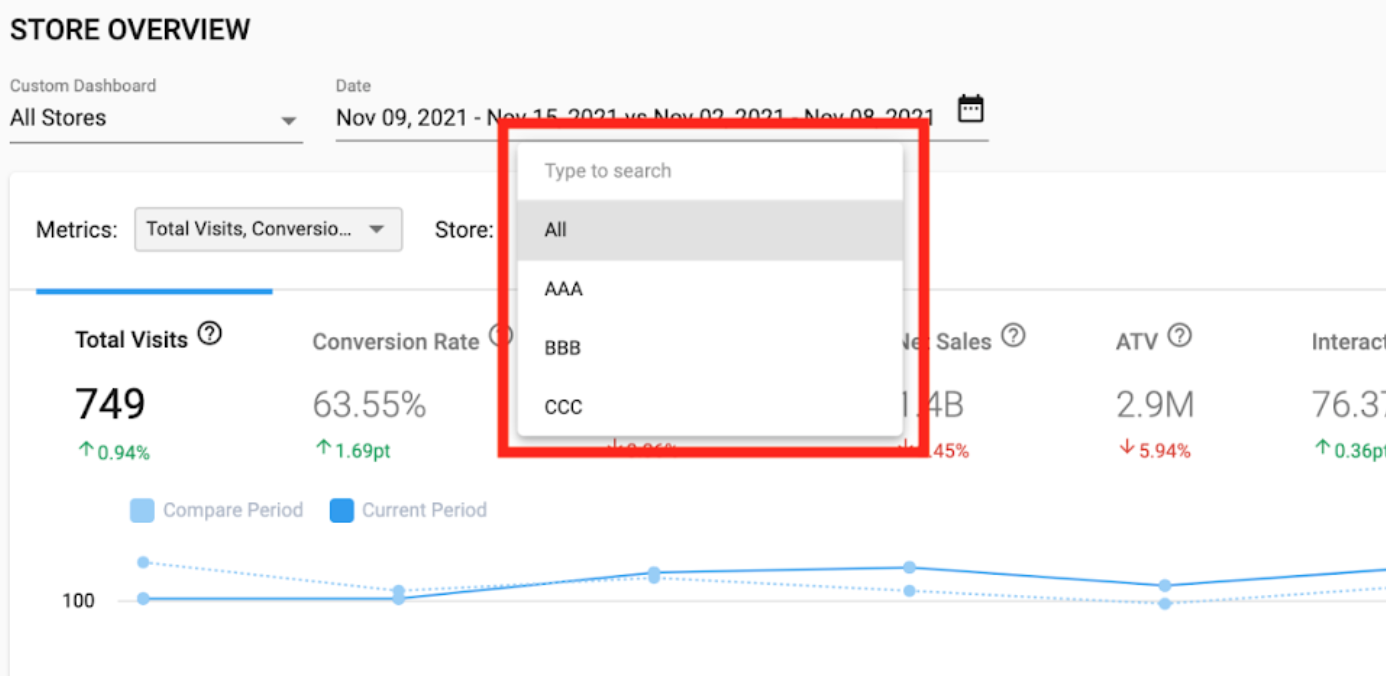
By default, the Store Overview report shows data of all stores that you are granted access to.
To view the chart for one single store, click on the Store drop box in combo chart to show the store list.
To view the chart for a subset of multiple stores, click on the drop box under Custom Dashboard and select Advanced Store Filter.


Enable Advanced Mode to quickly select multiple stores by store attributes.

Select/De-select Metrics
By default, the Palexy platform shows some metrics on the chart and the table. To see more/less than these defaulted indicators, click the Metrics field and the metrics selection popup will appear as below:

Note that you can always hover on the “?” icon next to all metrics to learn more about the metrics’ definitions.