Section Overview Report
In this section we will learn how to use Section Overview Report inside the Palexy platform.
Prerequisites
- You must have
READpermission on at least one store
Access Section Report
- Click on the “Sections” icon on the Menu bar on the left. Your report should look similar to the below image
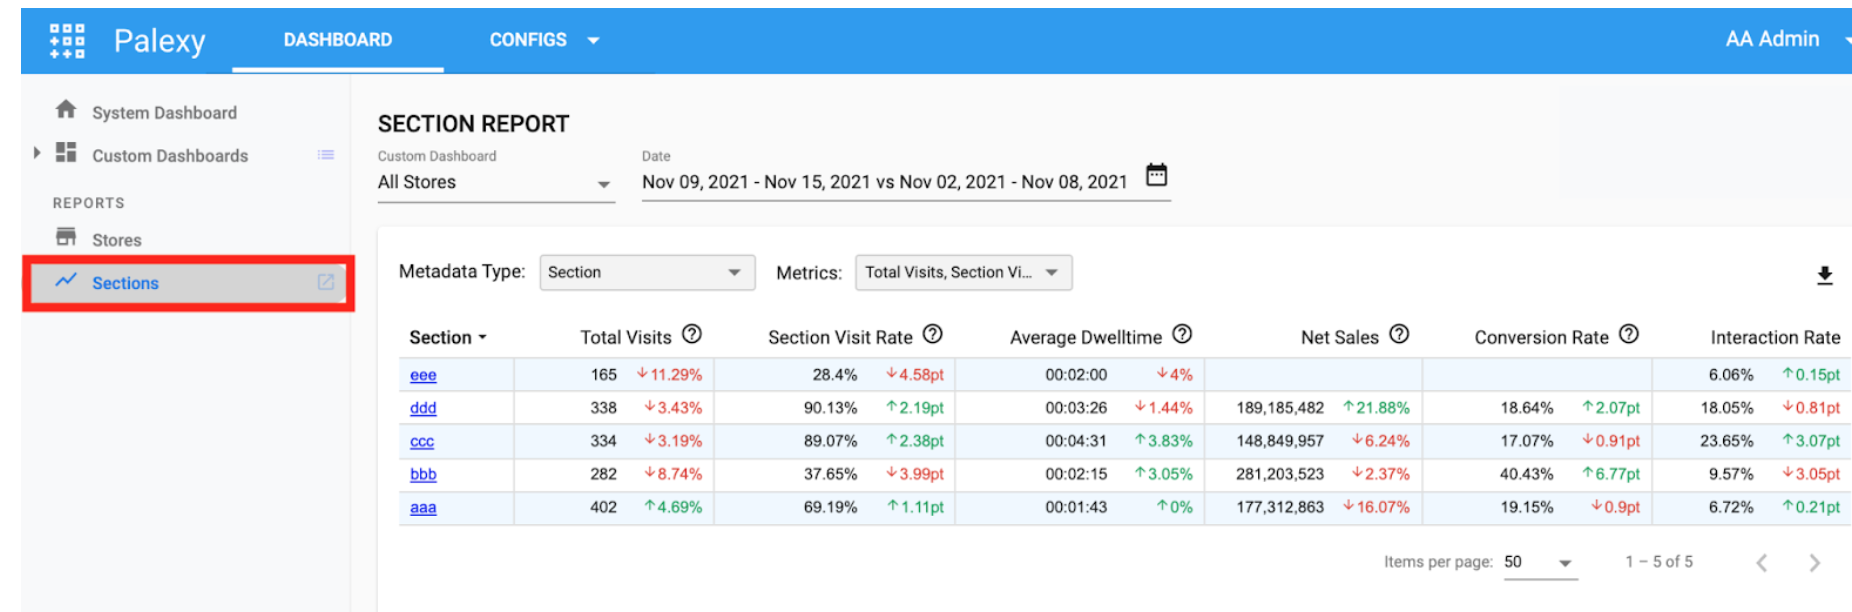
- In the table you can see data grouped by section names with all important metrics at first glance compared to the previous period.
- Click on the header of each column to sort the values in ascending or descending order.
- To see more/less metrics, click on the metrics filter.

- The metrics filters will appear as below:

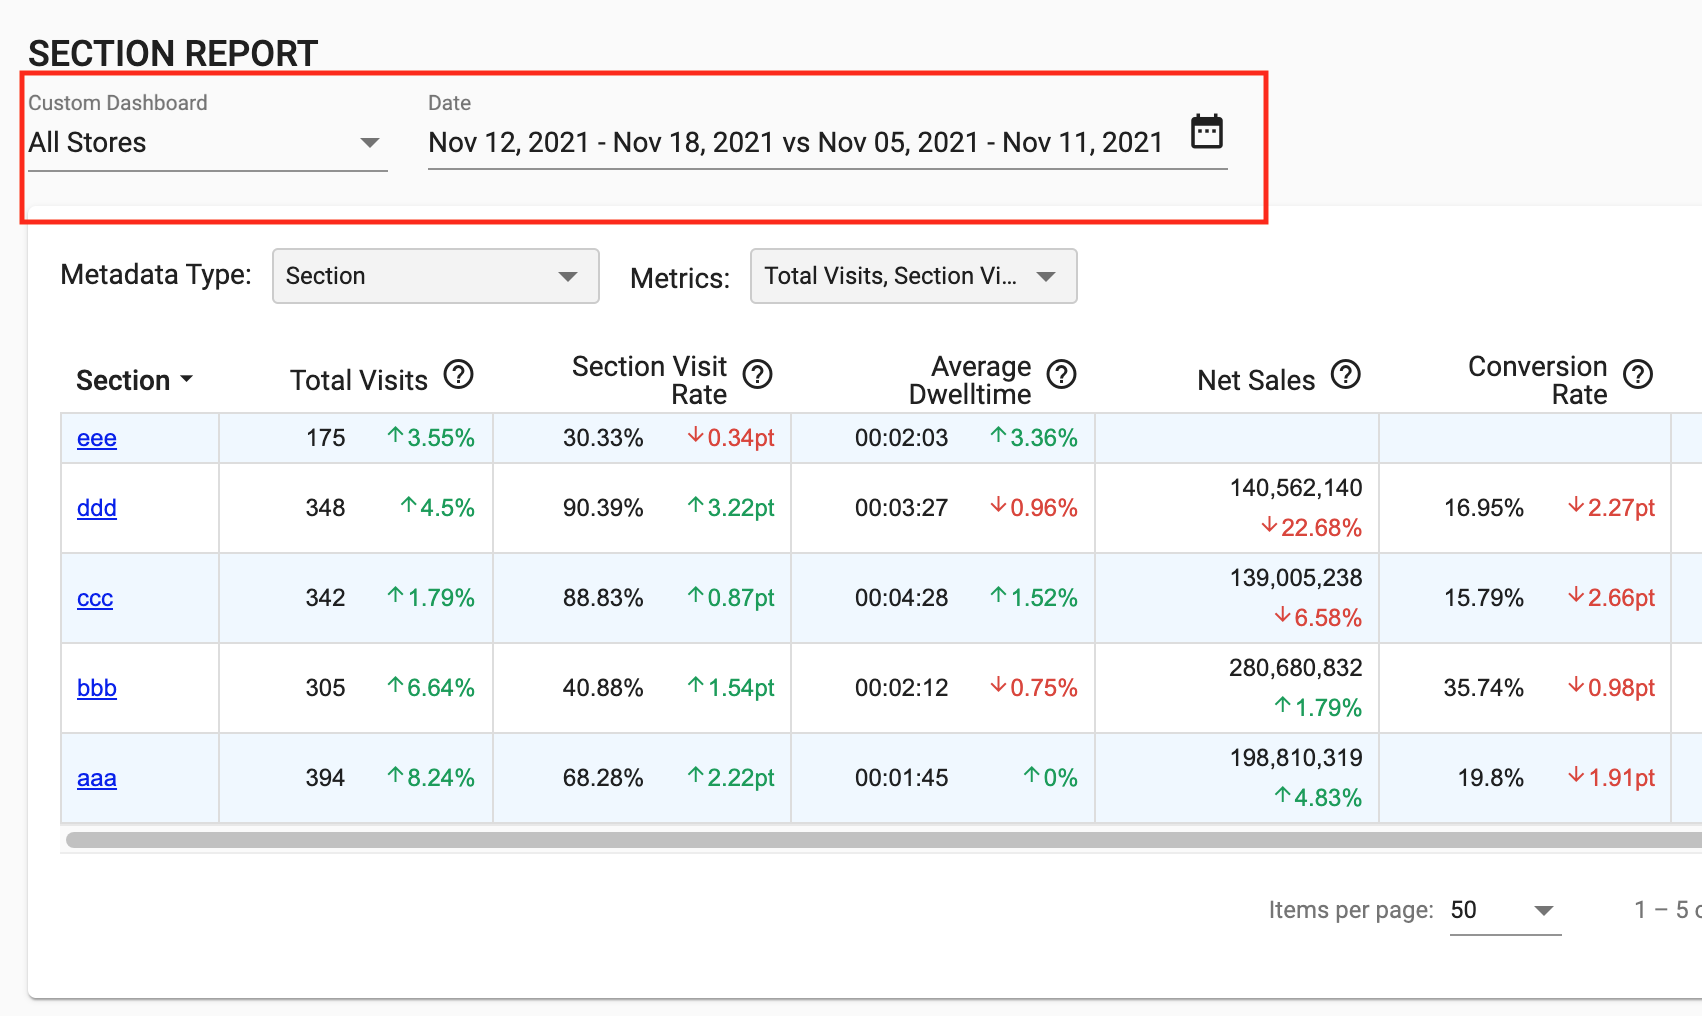
Click on the “?” icon to learn more about the metrics’ definitions of the metrics.
- In this report, you can change store as well as date range using the store filters and date range filters located the top of the page as below. Please read Store Overview report guide for more detail how to use date range and store filters: