Section Detail Report
Prerequisites
- You must have
READpermission on at least one store
How to Access Section Detail Report
-
To access section detail report, firstly you need to access the Section Overview report.
-
Click on a section name in the table view in the Section Overview report to go to the Section Detail report for that section.

-
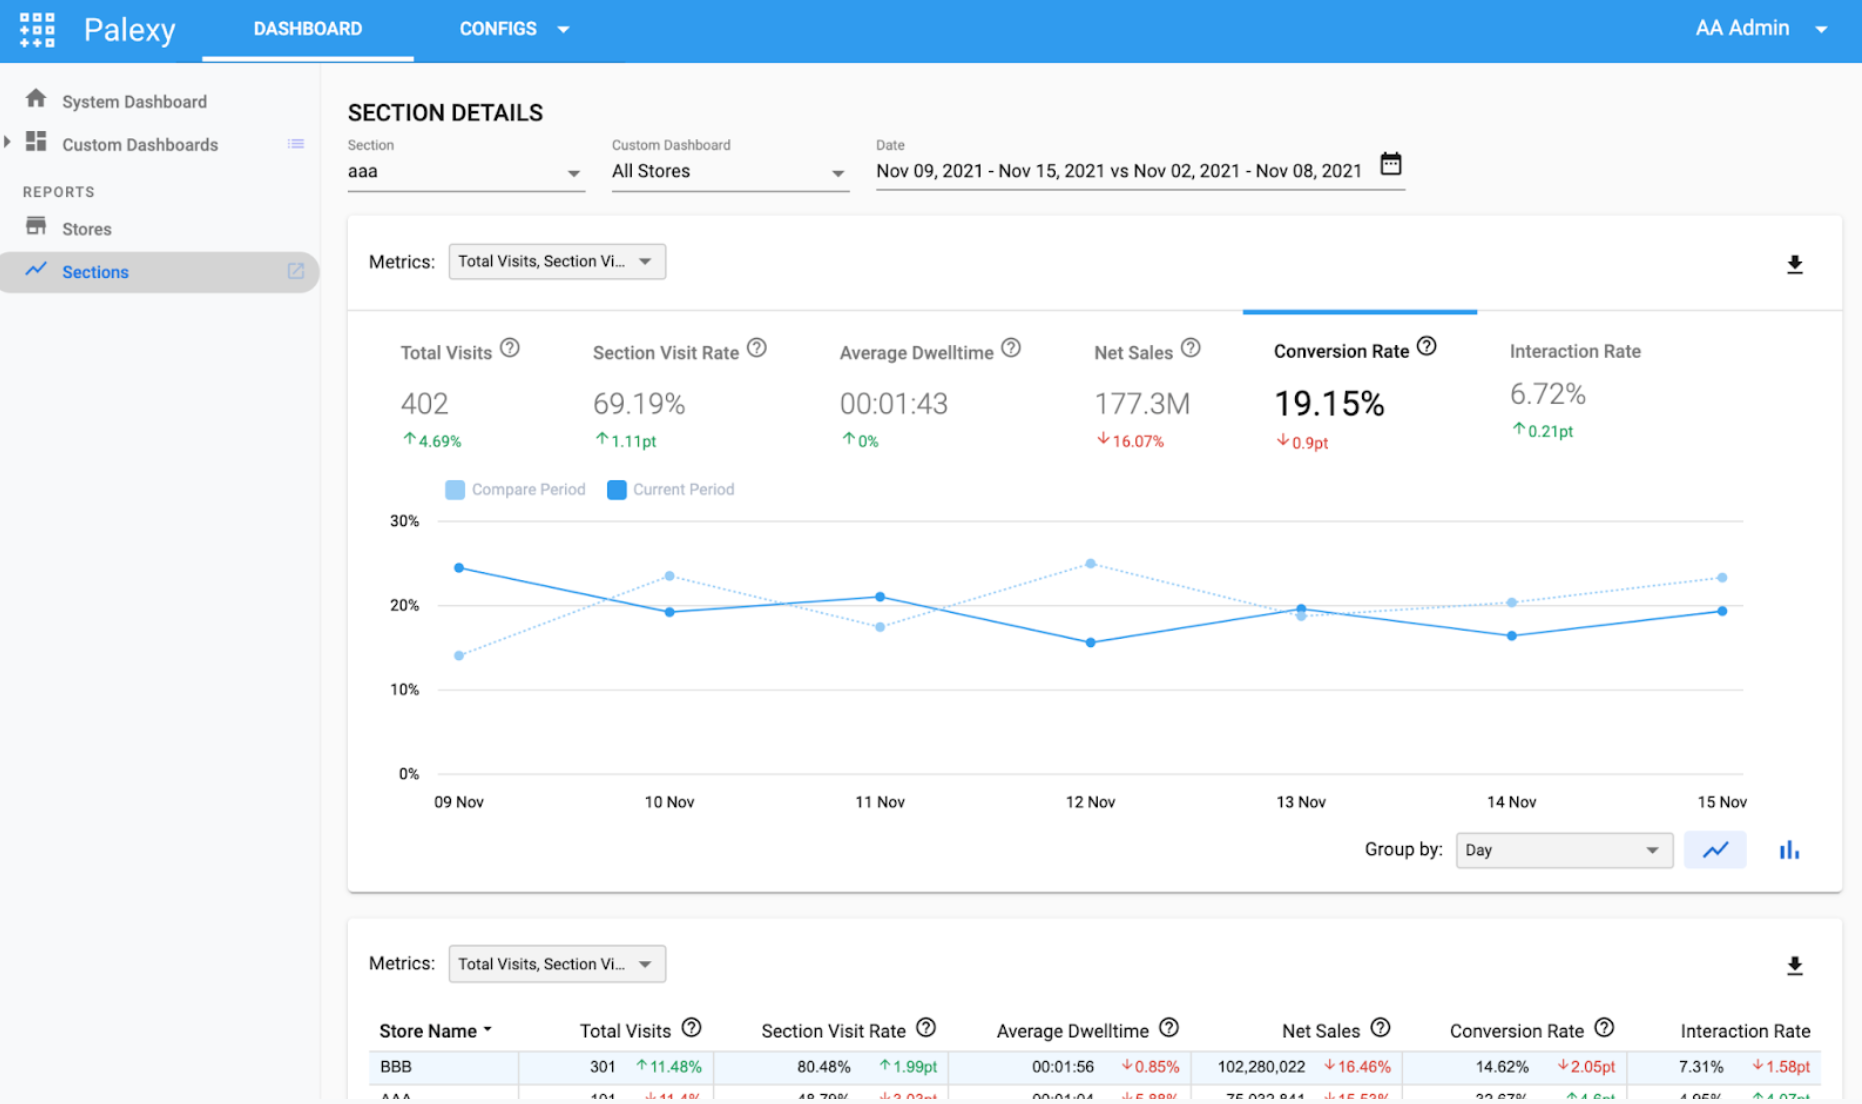
In the chart you can see all important metrics of this section over time compared to the previous period as below:
-
Please click on Conversion Rate metric to see Conversion Rate by day.
-
You can also view data grouped by hour/week/month, by your store hierarchy/ store attribute by clicking on Group by button at the bottom right of the chart. You can switch the view between line chart and bar chart by clicking on the symbol at the bottom right of the chart.

-
Scroll down to the table in the bottom of the page, you can see data grouped by stores and compared with previous periods also.

Each cell has 2 values including:
- The value of that metric during the selection period (black color)
- The level of increase and decrease compared to the comparison period (red or green color).
Click on the header of each column to sort the values in ascending or descending order.